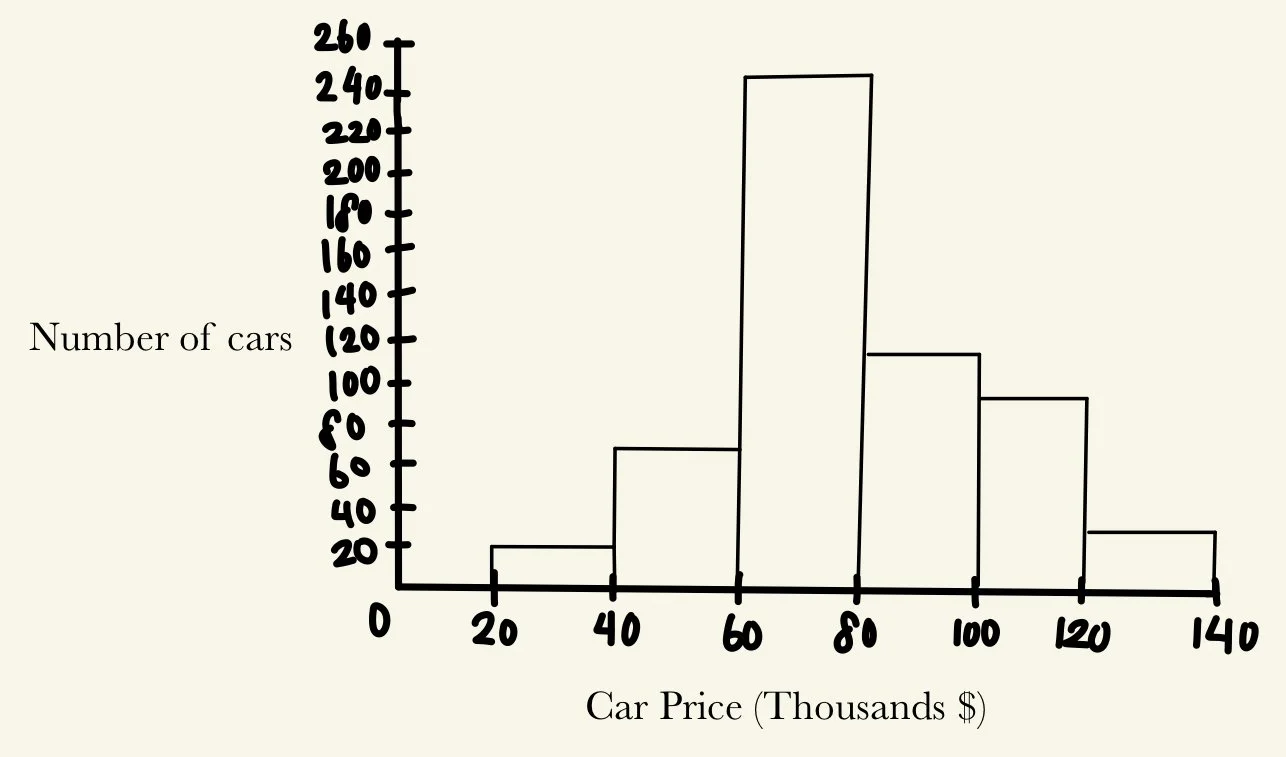
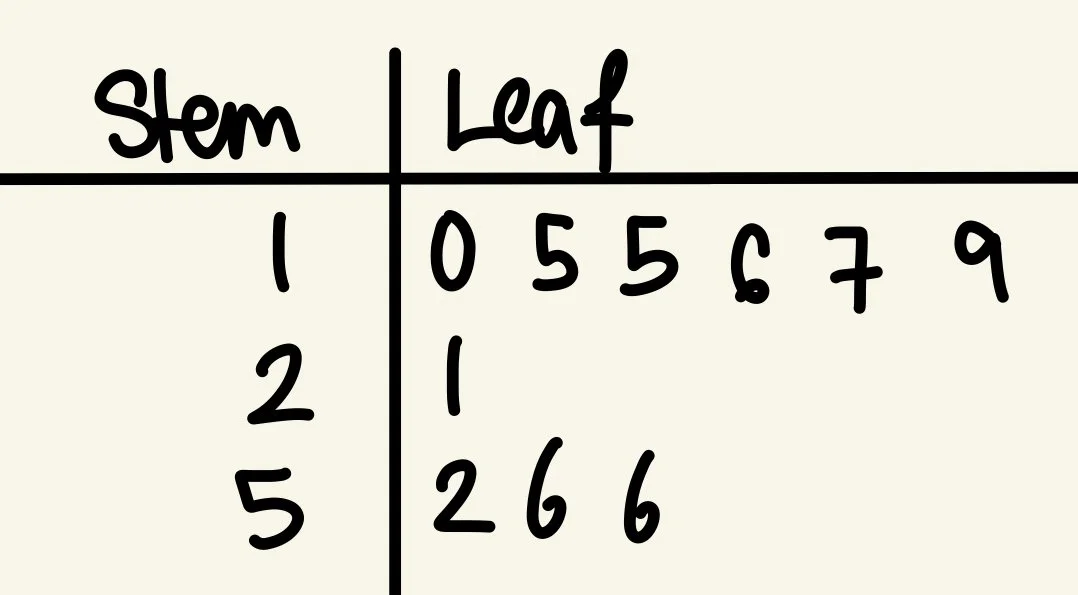
Histograms

Bar graph showing the number of cars at different price points in thousands of dollars, with the highest count at 80 thousand dollars, and smaller counts at 40, 100, 120 thousand dollars, and very few below 20 thousand dollars.
Learn more

Time Series Graphs

Two-Way Tables

Learn more

Distributions & Skewness

Stem-and-Leaf Plots

Learn more