Stem-and-Leaf Plots
When I first learned about stem-and-leaf plots, I found them highly unconventional and practically useless outside of the classroom. I’ve grown to appreciate them, however, and I hope you will gain a better understanding of what they are and how to use them after this article.
Suppose we have a number 15. In a stem-and-leaf plot, the 15 is split into 1 in the stem section and 5 in the leaf section:
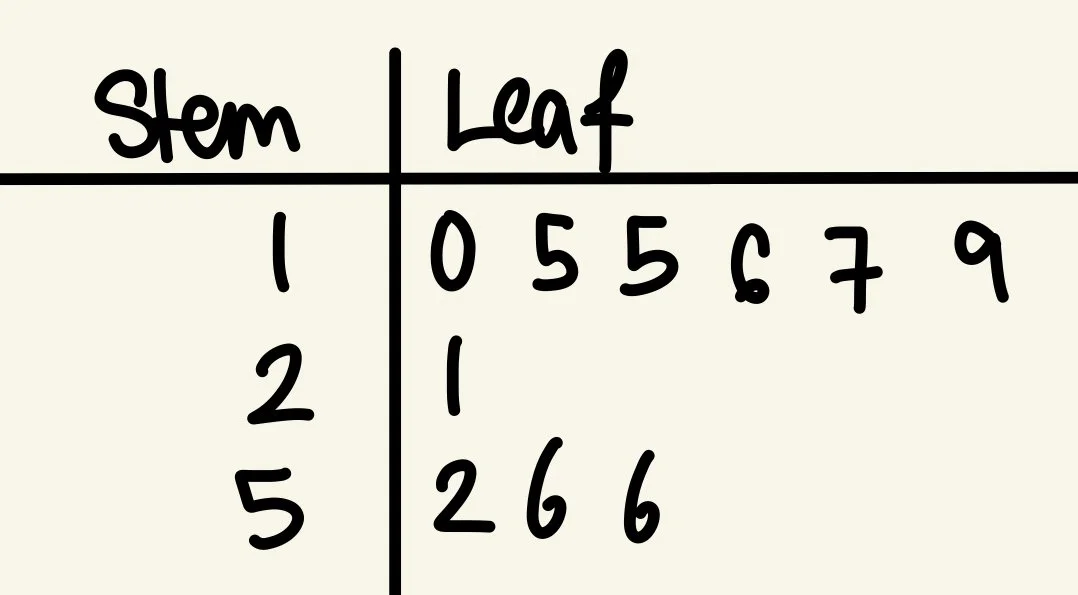
As the name suggests, the stem and leaf plot is modelled after the plant. In terms of data analysis, they are useful as a visual summary of the distribution and shape of the data. They are mostly used with small datasets, or else you’d spend quite some time recording all the data points (by hand at least). Consider the following stem-and-leaf plot with a full dataset {10, 15, 15, 16, 17, 19, 21, 52, 56, 56}:
We can immediately tell how often a data point appears (which is repeated) and its distribution. In this case, most points hover in the 10-20 range, and some exist in the 50 range.
The fact that stem-and-leaf plots are easy to create makes them a great method for basic data analysis! Here is some additional practice/extended learning for reading and working with these plots: