Two-Way Frequency Tables
A two-way frequency table depicts the frequencies of two categorical variables, which are variables that can be put into categories instead of having numerical values (ex. hair colour, eye colour, car brand). For example, let’s say we have two stores selling two types of pie: key lime and cherry. A two-way table displaying the numbers of each they sell in an hour is as follows:
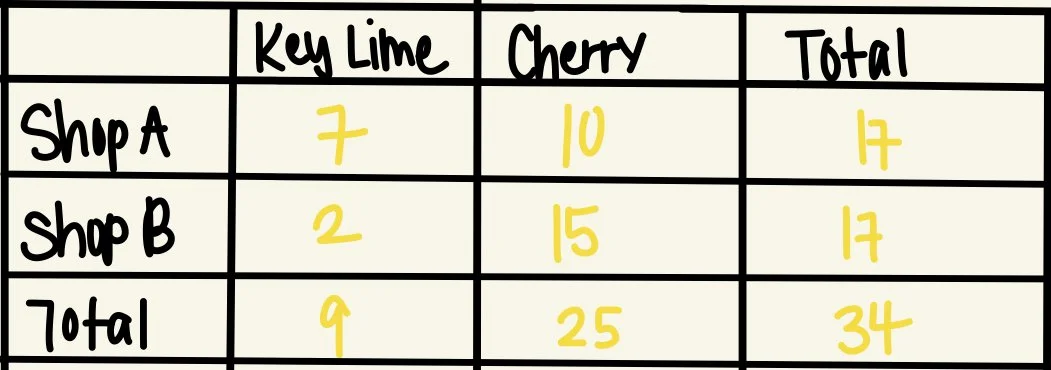
We can access a variety of information: the number of key lime pies sold, the number of cherry pies sold, and the number of total pies sold by each of the two shops. The marginal frequency refers to the frequency of a specific category. In the table above, the total number of key lime pies sold across the two shops being 9 is a marginal frequency.
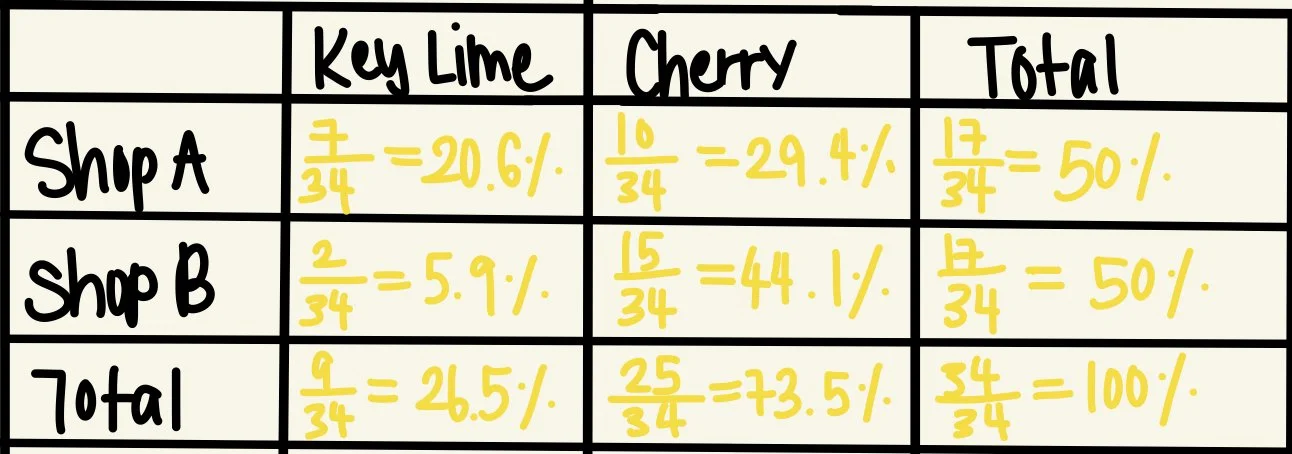
A two-way relative frequency table displays the percentage or fraction of the total. All we have to do is divide each number from each category by the total. Rewriting the table above in this format, we would have
Alternatively, a two-way frequency table can also display percentages/fractions of the row/column totals, as follows:
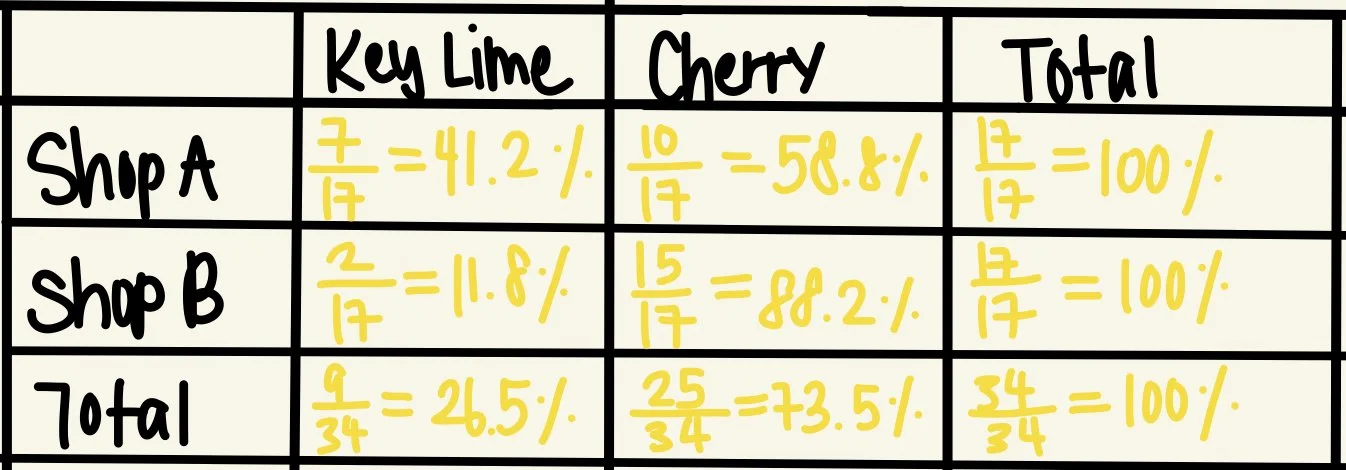
Specifically here, the denominators across shops A and B are the marginal frequencies of the total number of pies sold in each shop. For the totals, the denominator remains the total number of pies, which is 34.